History: Canon and Nikon thought DSLRs were the future when Olympus launched the E-M1 in 2013. It took them years to catch up...

Jan 24, 2024

Color and FX-Blue Chrome effect for Olympus

Last Updated:- 3rd February 2024

Introduction

The illustration below is a screen copy of my Workspace "before/after" display. Study the links below for a description of the Fuji Color and FX-Blue Chrome effects. I combined these descriptions into one beta Chrome Effect for Olympus. The Fuji Color Chrome effects work for all Fuji "Picture Modes," whereas the Olympus Color Adjust function only works in the "Natural" Picture Mode. The final Fuji Chrome Series for Olympus cameras could be 3 chrome profiles. (Color, blue, and combined)

This short article discusses two processes for developing a new profile. Why are the Olympus EP-7 and Pen-F so different? All digital cameras work with global adjustments like saturation, color filters, and White Balance. They require a good understanding of working with Opposite Colors. For example, the Olympus Color Creator and White Balance functions use analogous and/or opposite colors. Only the Color Adjust Tool of Workspace, Pen-F, and EP-7 target specific colors in the image.

Fujifilm Color-Chrome Effect - link

Fujifilm FX-Blue Chrome Effect - link


Olympus Pen F with beta Chrome profile.

Fuji Color and FX-Blue Chrome Effect - Version 1

The unique aspect of this Chrome effect is the steps I used to create the profile. The profile is my reaction to the two articles discussing the Fuji Color and FX-Blue Chrome effects. This can happen to anyone seeing or learning something new and like to express that experience in a color profile.

Download this 1st beta "Color and FX-Blue Chrome.oes" profile. Use the Batch tool in Workspace to open and save the profile on your PC. See my Workspace How-to page for more...


Fuji Color and FX-Blue Chrome Profile.

The Fuji Color plus FX-Blue Chrome Profile is designed for the Pen-F, EP-7, and compatible OMDs. For example, I successfully tried the profile on Raw files from my EM10 II and the original EM-1. Only the Pen F and EP-7 have the Color Adjust function and will accept Color Profiles. The alternative is to apply these profiles via the Enhanced Raw Format to compatible Pen and OMD cameras.


Study the above profile data (summary) and the steps below to tweak the profile:

  1. Use the "Auto" option for your WB, or select a unique WB. (Critical step) 
  2. Use Exposure compensation and the histogram to set the ISO brightness.
  3. Use the different Tone Adjustments to tweak the camera's Gamma Curve.
  4. Some Olympus cameras, like the EM10 II, do not have a Midtones Slider.
  5. Use Exposure Compensation for those cameras lacking a Midtones Slider.
  6. The Auto or Normal Gradation option varies your final Tone Curve shape.


Olympus EM1 II with 18mm f1.8 lens - ISO200, f7.1, 1/800. The Enhanced Raw File was converted with the Fuji Chrome Profile.

The Tonal Adjustments in the Camera and Workspace are Gradation, Shadows/Midtones/Highlights, and the Workspace Tone Curve option. Why do we need ISO brightness (EC) and separate Tonal Data Adjustments? Workspace and the camera's Gamma Curve convert the sensor's linear raw data to a human (JPEG) format. Tonal adjustments let us tweak the Gamma Curve in the camera and Workspace. Exposure Compensation (ISO) is part of the camera's Exposure Formula.

Study this article for more on exposure compensation, image brightness, and ISO.


Olympus E-P7 with 17mm f1.8 lens - ISO100, f8.0, 1/200. The enhanced Raw File was converted with the Fuji Chrome Profile.

Use the Color Adjust tool of Workspace to tweak the Chrome effect. I studied the above information from Fuji and converted +/-50 Enhanced Raw Files to create this Beta profile. What is the next step? The next version of the Fuji Color Chrome effect will be based on Color Cards and Test Images from my Fuji XT-5 and the Olympus Pen-F. Mail me your feedback or input for the 2nd version.


An example of using multiple steps. 1. Tweak the Natural Picture Mode. 2. Tweak the Color Style. 3. Image jpeg adjustments.


One could also use multiple steps to create a unique image look. This is a more advanced option because the different steps happen simultaneously. We can add another level with the Luminance and Hue options of the Color Adjust tool. The Pen F and EP-7 do not have these options. The first step is global adjustments (opposite colors), and the second is specific colors. (Adjust Color Function)

For example:
  1. Tweak the Picture Mode via Color Filters and the White Balance.
  2. Tweak the colors in the Color Style with the Adjust Color function.
  3. Jpeg adjustments like Contrast, Saturation, Clarity, Dehaze, and Sharpness. 

Olympus Pen-F with the 9-18mm f4-5.6 lens - ISO200, f4.5, 1/1250 - Version 2 of the Color Chrome effect.


Fuji Color and FX-Blue Chrome Effect - Version 2


I used a "controlled" studio, standard camera settings, and Color Cards. Both cameras were in Manual Mode, with the XT-5 at ISO125 and the Pen F at ISO200. That meant I needed to correct the ISO brightness of the XT-5's raw sample in Fuji's X Raw Studio. I exported the different raw images as 16-bit Tiffs. That meant the color samples were ready for Workspace and the Adjust Color tool.

I used these 16-bit samples in the "Compare Multiple Images" display of Workspace. This enabled me to copy the XT-5 "chrome effect" and transfer it to the Pen F color card. The illustration below shows the original and the new Adjust Color Style for my Fuji Color and FX-Blue Chrome effect. 

You are welcome to download the new version here. - link


What is the main difference between these profiles? The Color Cards allowed me to create a more accurate version of the Fuji Color and FX-Blue Chrome effect. Only the Adjust Color tool has the new Color Style values. None of the other functions were used to create the new Color Style. This allowed me to use default values for the remaining Camera and Workspace settings. Verify that only the Adjust Color tool was adjusted before you continue to edit the profile in Workspace.

The previous version of the Fuji Chrome Profile was created from the information I found. The profile consisted of a combination of the Adjust Color function and other image settings. As can be seen, this method is not necessarily incorrect. It's simply a creative reaction to general information. The second method is more reliable because I used a different Color Card for each camera.

The new Fuji Color and FX-Blue Chrome effect has a specific Color Style. We only need the color style to apply the new profile. Any other image tweaks, like Tonal Adjustments, are unique to the scene. This makes the new profile very unique. It lets users develop a basic step-by-step process for using the profile and editing images with the new Fuji Color and FX-Blue Chrome effect.


Olympus OM10 II with 17mm f1.8 lens - ISO200, f3.2, 1/2500. Workspace with Version 2 of the Fuji Chrome effect.


More info on the Fuji V2 Chrome Effect? The final profile is not only more accurate, but it is also more user-friendly. How could that be? Workspace has become my default raw converter and editor in the past two years. Workspace and Photoshop cover +95% of my editing needs. I export my converted 16-bit Tiff files to Photoshop. Like everything, the more we use it, the more we learn.

The new profile highlights one of the main differences between Olympus and other brands. Almost all brands use global adjustments, whereas Workspace, the Pen-f, and the E-P7 allow us to adjust global and targetted colors. Targeted colors are unique for Workspace, Pen-F, and the EP-7. What makes it different is that the camera's Adjust Color Style is part of the Enhanced Raw Format.


Olympus Pen-F with 17mm f1.8 and the new Fuji Color Chrome effect.


It's critical to master the main difference between targeted and global settings. The Color Creator is an example of using Global Settings. The Color Creator, White Balance, and Color Filters change the selected and opposite colors. Color profiles created with Global Adjustments need additional steps, like tweaking the Image jpeg Settings. Targeted color profiles are only done in the Adjust Color tool. The resulting configuration defines the new Color Style. That means more freedom to edit and tweak the remaining image (scene) settings because the Color Style stays fixed.


How to use the new Fuji Color Chrome Profile? The first step is studying the above chart. The next step is downloading the new profile. Save it in your Workspace profile folder.

Do the following steps to open and edit your Fuji Color Chrome effect in Workspace:

  • Open any Pen-F or EM1 Raw file and select the "Load Batch Processing file" option.
  • View the camera settings in Workspace. You will see only the Adjust Color was used.
  • The Adjust Color settings show the Color Style. That means you have the right profile.
  • Study the above chart for tips to tweak and edit your image. Apply small adjustments.
  • You can apply the following editing steps in Workspace:-
    • Focus on the critical Raw settings like (ISO) Exposure Compensation and WB.
    • The next step is to tweak the Gamma Curve with different Tonal Adjustments.
    • The final step is typical Jpeg Image Adjustments and the Noise Filter selection.
  • Adjust the Fuji Color Chrome effect (Weak/Strong) with the Adjust Color function.


Olympus Pen-F with 9-18mm F4 lens - ISO200, f4, 1/1000. The Pen-F with the Fuji Color and FX-Blue Chrome effect.


Everyone should try the color samples below to create a Fuji Color Chrome effect. For example, I only used saturation with the Adjust Color function. You could add Hue and Luminance adjustments for a more accurate profile. I used saturation adjustments in Workspace because I wanted the new Fuji Color Chrome Profile ready for my Olympus Pen-F and the EP-7.

Conclusion

The next step is taking a few images with my Fuji XT-5 and Olympus Pen-F. This is the best way to test the new Fuji Color and FX-Blue Chrome effect for Olympus. The challenge is the winter season, with poor conditions and cold photo walks. That means my final testing will wait a while...

Best Regards

Siegfried


Olympus EP-7 with 17mm f2.8 lens - ISO200, f5, 1/200. The EP-7 image with the Fuji Color and FX-Blue Chrome effect.


Use these Color Samples and Workspace to create your Chrome Profile.


Jan 6, 2024

The 4 things that could improve your Image Quality

Last update:- 22nd January 2024

Introduction

Many social media presenters introduced 2024 with a list of photography essentials. While having good intentions, it's surprising to see how well-known influencers repeat incorrect information.

This inspired me to review the following talking points and introduce a new technique:

  1. "Focus" on the subject, and don't let the background or DR distract you.
  2. Exposure Triangle - Replace "ISO Sensitivity" with "Image Brightness."
  3. Discard all "size and capture" theorists explaining image sensors/cameras.
  4. Knowledge and regular practice are +50% of what makes photography fun.


EM1 III w Lumix 35-100mm f2.8 - ISO200 (400), f8, 1/640. ISO400 plus ETTR (+1EV) gave me a +/-2EV brightness variation. See the article.

Imagine you are photographing a blue hour or city scene at night, and it's possible to adjust the image brightness just enough to get more details from street lamps and/or restaurant/shop windows...

How did I take the images below? I used a technique that control the sensor and ISO separately. That means I independently manage my sensor's saturation and the ISO (image brightness).


Figure 1.

1. Focus on your subject, and don't let the background distract you

I am a keen follower of the Danish photographer Thorsten Overgaard. I like his work, enthusiasm for Leica cameras, and passion for photography. Thorsten discusses 4 essentials that could improve your photography in 2024. Many presenters and photographers assume the ISO function on digital cameras is similar to film cameras. Folks, the ISO function does not adjust the sensor's sensitivity.

Watch Thorsten's video for more on his 4 essentials, like focusing on the subject...


2. Remove ISO Sensitivity from the Exposure Triangle

The best way to think of your ISO function is to view it as an in-camera brightness slider. The image sensor and ISO amplifier are separate components. The sensor's sensitivity is measured and adjusted at the factory. This is a once-off and permanent adjustment that prepares the image sensor for use with digital cameras. The ISO function simply amplifies the image signal from the sensor...


Study this article for more details.


Why is the "Digital Exposure Triangle" different? It allows us to improve our tonal (image) data. The ISO "sensitivity" theory limits our ability to manage the sensor's saturation. This and a lower Dynamic Range are why "experts" say ETTR isn't safe at higher ISOs. This article focuses on the benefits of having a saturated sensor and using the ISO as a brightness slider (image signal amplifier).


EM5 II & 7-14mm f2.8 lens - ISO800, f2.8, 1/250. The Advanced Raw File was converted in WS. The new ISO technique will benefit this photo...

The information below applies to all digital cameras:

  1. The Shutter and Aperture are responsible for exposing the sensor.
  2. The ISO function only amplifies the image signal from the sensor.
  3. This doesn't mean the ISO is not part of the camera's exposure calc.

Consider this when you set your camera's exposure with the Digital Exposure Triangle:

  • Reflected light (Shutter Speed and Aperture) controls the sensor's saturation level.
  • More reflected light saturates the sensor. This improves the SNR, which decreases noise.
  • Less reflected light decreases the Saturation/SNR. A smaller SNR increases visible noise.
  • Study the Photons to Electrons conversion graph in one of my previous articles - link.
This brief summary explains why ALL digital cameras have visible noise at lower SNR values...


EM1 MKI & 12mm f2 lens - ISO1250, f2.0, 1/25. The Enhanced Raw File was converted in WS. These scenes benefit from the ISO technique.

3. Avoid any "size and capture" theorists explaining digital cameras

The left photo in Figure 1 is the JPEG from the EM5 II, and the one on the right is the converted and adjusted raw file. They're an expression of knowing your camera and Workspace. They are NOT the result of AI, computational photography, a LUT, or advanced image editing. Photographers in Group A will typically complain about the EM5's small sensor and its low dynamic range, and those in Group (image) B will discuss new ideas to improve their knowledge and technique?


Olympus EM5 II & 12-200mm f3.5-6.3 Lens - ISO200, f7.1, 1/500. The new ISO technique lets us control any highlights in the above scene.


4. Knowledge and practice are +50% of what makes photography fun

How did I create Image B (Figure 1)? I separately optimized the sensor from my ISO. Image quality is a function of sensor saturation, and image brightness is a function of the ISO, Gamma Curve (camera and WS), and Workspace (Exposure Compensation). The EM5 II is known for its image quality and the sensor's smaller noise floor. The DxOMark "Low-Light ISO" rating gives us a safe range to tweak our highlights in the camera and Workspace (WS). (1 to 2 stops are all we need)

This new technique consists of a few basic steps. The Image brightness can be adjusted in the camera or Workspace while the sensor is saturated. We can also use Gradation, Highlights/Shadows, and/or the WS Tone Curve to tweak the Enhanced Raw File's Gamma Curve in the camera or Workspace.


Olympus E620 w 12-60mm f2.8 Lens - ISO100, f8.0, 1Sec. 3 AE bracketed raw files were converted and edited (HDR) in Photoshop.

Are there other ways to create Photo B? Absolutely. I used this method to show the camera's sensor and ISO function. Some will say the EM5 II is ISO Invariant. Folks, the "size and capture" theory and "ISO Invariance" are marketing theories. Those pushing them can't clearly explain the origins of image noise (SNR), the sensor's noise floor, or why only "some" sensors are "ISO Invariant."

Here are the steps I used to create Image B:

  1. Image A. The sensor was exposed (f4.0 and 1/25) at its base ISO200 (Auto Exposure).
  2. The DxOMark "Low Light" Sports rating showed I could safely vary the ISO with +/- 2EV.
  3. That meant the camera's "highlight" exposure settings should be f4 and 1/100 at ISO800.
  4. I manually used ISO200, f4, and 1/80th shutter speed @ 20% ETTR (+/- 2EV highlights).
  5. ISO200 gave me control over any clipping highlights with the camera and Workspace.
  6. I applied my final ISO (brightness) adjustments via the Enhanced Raw File & Workspace.
  7. With regular practice, it's also possible to edit the Gamma & brightness in the camera.


Olympus E410 w 14-42mm lens - ISO400, f13, 13 Sec. The highlights and general IQ of the E-410 will benefit from this ISO technique.

It takes time to visualize and create new techniques. It improves our experience in problem-solving, Olympus Cameras, and Workspace. For example, the concept of ALL sensors having a noise floor is part of this technique. It's only possible to control any clipping highlights with an optimally exposed sensor. I experienced no increase in noise for Photo B (ISO200, -2EV image) or the image below.

Here is another method to create Photo B (Fig. 1). Olympus cameras automatically vary the sensor's saturation level with AE Bracketing. That means the camera doesn't change the ISO in AE bracketing mode. Use ISO800 and the "2f 1.0EV" bracketing option to take 2 photos. Manually take another image at ISO200 (-2EV) and the 20% ETTR aperture and shutter values. Do your final Gamma Curve and image brightness adjustments in the camera or Workspace.


Olympus EM5 II w 7-14mm f2.8 lens - ISO64, f7.1, 1/125. ISO64 helped me to up the SNR and saturate the sensor.

Conclusion

Modern digital cameras and mobile phones are great products with excellent Image Quality. While AI re-uses (copies) almost anything someone else puts on the web, the difference is those who step away from reckless marketing theories, master their digital cameras, and practice frequently.

This article showed the value of knowing your digital camera. It enabled me to control the clipping highlights while managing the sensor's SNR independently. This ISO technique is designed to benefit from the DxOMark "Acceptable Image Quality" rating, meaning I will have a minimum Color Depth of 18, a DR of 9EV, and an SNR of 30db (no ETTR) at ISO800. My ability to prioritize and select/edit older RAW files benefited from my ISO, Sensor Saturation, and SNR (visible image noise) knowledge...

One final example of timing, compositions, and complex exposures.


Alex Nail is a great landscape photographer. He took a group of photographers into the Drakensberg mountains. The vegetation in this mountainous region brought back memories of my Heimat, South Africa. Image quality is not only a function of your camera because all digital cameras have unique strengths and weaknesses. The joy of photography is mastering your camera's limitations...


Jan 3, 2024

How to read the DxOMark Image Quality database

Last updated:- 19st April 2024

DxOMark has been in the image quality business since 2003. They empower photographers with good information and knowledge, helping them make informed and autonomous decisions. They translated this goal into a unique Image Quality Database, which many photographers use to learn more about their cameras. The test data also enable photographers to use their cameras more efficiently. 

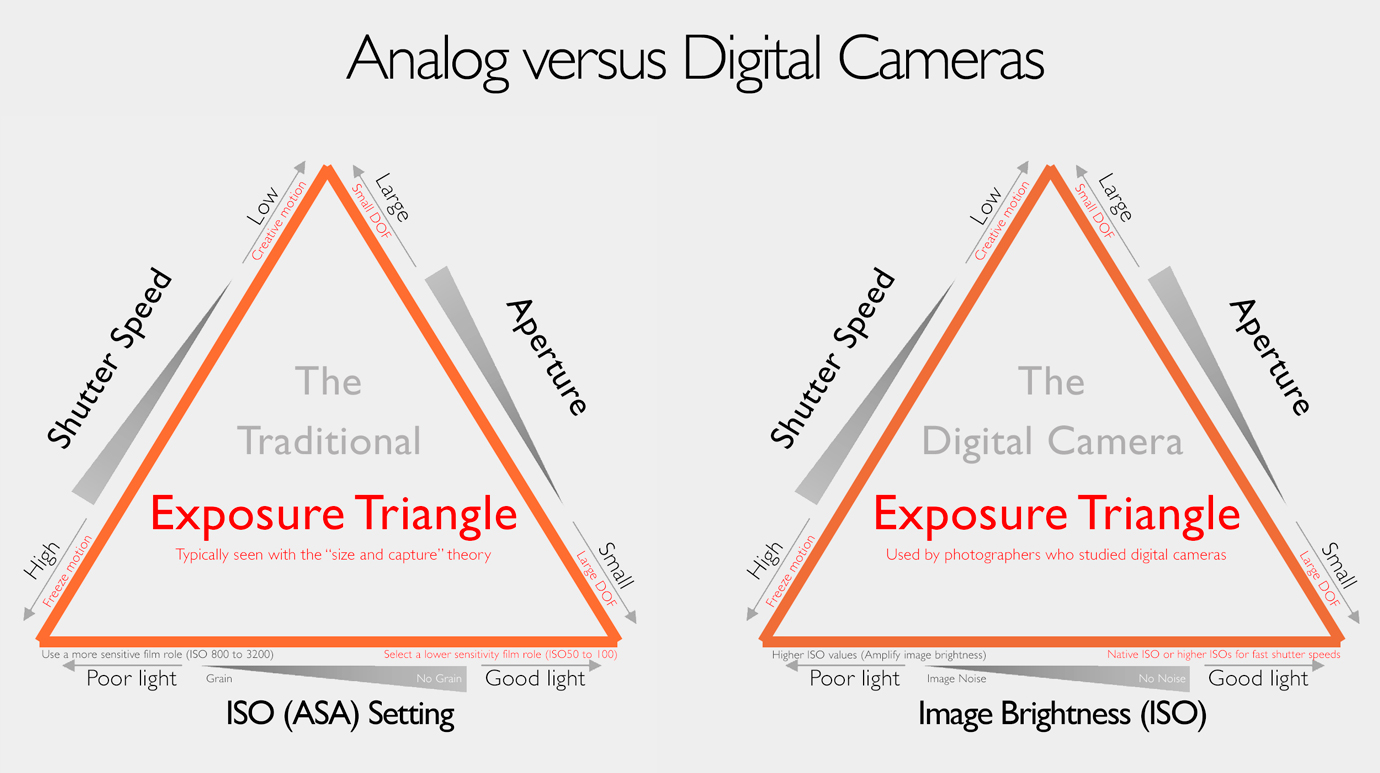
Did you know DxOMark does not support the "size and capture" theory? It's exciting to discover how they use a theoretical model to test, evaluate, and present their test data on camera sensors.

Please visit DxOMark.com and demonstrate your support by liking my EM1 II conversation with DxO. Add comments and ask DxO for updates on the EM1 III, EM1X, EP-7, EM10 IV, and OM-1.

Note:- The Olympus EP-3, EM5 II, and G11 images were done for this article...


Do all 16MP and 20MP Olympus cameras have Good Image Quality?


                                                                                                                        Source:- DxOMARK

The challenge with finding a new camera is repetitive expert opinions and commercial bias. Accurate information became a rare marketing quality in 2023/2024. For example, many photographers see no or little IQ benefits when they "upgrade" to a new camera or format? It is, therefore, comforting to know that DxOMark uses its own scientists and camera test engineers.

With a small camera portfolio, DxOMark became one of only a few companies using a theoretical test procedure for Camera Sensors and IQ. With almost 400 tested cameras since 2012, they created one of the most reliable test results (databases) for camera sensors, lenses, and image quality.


Olympus EP-7 with 17mm f1.8 lens, ISO200, f7.1, 1/800 - Raw file converted and edited in Workspace.


We are focussing on the DxOMark Image Quality database. While relevant, the DxO database does not include data on computational features, size/weight comparisons, auto-focussing, or the practical aspects of using the camera or lens. For example, I always enjoyed my Olympus EM1 II, but the EM1 MKIII supercharged my passion for Olympus and computational photography.

I tested the impact Pixel Area has on 15 cameras in this article...


Olympus EP-3 with Lumix 20mm f1.7 lens, ISO200, f5, 1/500 - Raw converted and edited in WS. This is the EP3 "OOC" jpeg look.


This article reviews the test results DxOMark published over the past 11 years. These test results can be found in the sensor (image quality) database at DxOMark. I also included a short example of using these test results and how they benefit M43 photographers. Finally, I added an example of preparing any camera for "acceptable image quality" and what that looks like in real life.

See this DxO article discussing the challenges of designing mirrorless camera sensors...


Olympus EM1 II


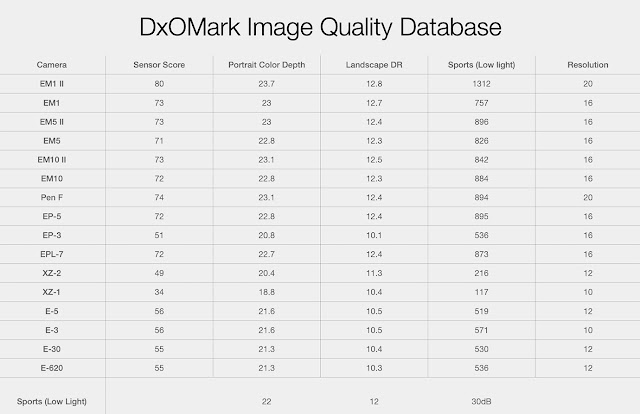
How should we interpret the above DxO Scorecard? DxO publishes a scorecard on its website for each tested camera. The scorecard includes an Overall Test Score, Color Depth in Portrait mode, Dynamic Range in landscape mode, and Low Light ISO performance in Sport mode. The summary markers (below) apply to the overall score plus the 3 applications DxOMark reviews. 

Also, study the summary notes from DxO in blue:-

Overall Score

  • The DxO tests are done at the camera's base ISO and using a logarithmic scale.
  • They measure sensor sensitivity, color depth, and the sensor's noise floor.
  • The difference in sensor sensitivity is 0.3EV for every 5 points.

Portrait

  • The higher the color sensitivity, the more color nuances can be distinguished.
  • A 22 Color Depth means the sensor or camera is an excellent performer.
  • Anything less than 1 point between 2 cameras is insignificant.

Landscape

  • DxO regards a dynamic range of 12EV as sufficient (excellent).
  • There is no significant DR variance between the EM1 II and 13.3EV.
  • A 0.5EV difference between cameras can be regarded as insignificant.

Sports

  • DxO measures the sensor's Saturation and SNR (logarithmic) at the camera's base ISO.
  • The Low Light ISO rating is set at an SNR of 30db, a DR of 9EV, and an 18-color depth.
  • With a linear progression on M43 sensors, an estimated OM-1 Low-Light ISO is +2000 *.
  • Considering the GH5 & GH5 II, how much did the EM1 III and EM1X improve (+1600)?
  • A Low Light ISO difference of 25% is the same as 0.3EV and only slightly visible.


* Why did I up my estimated OM-1 low-light ISO rating from 1867 (calc.) to +2000? The BSI sensor is more sensitive than Live MOS sensors, plus several TruePic X efficiency improvements. See this link for a more detailed description of the above DxO test procedures.


Photographed with the 40MP Fuji XT-5. Did you know the XT-5's pixel area is less than the EM1 III?


The DxOMark sensor database has several benefits for photographers. For example, the theoretical principles discussed in my articles reflect the theoretical model DxO uses to test camera sensors. A theoretical model says each sensor has a unique Noise Floor while highlighting the importance of Sensor Sensitivity, Saturation, and SNR as indicators to monitor sensor performance..

The illustration below explains image sensors, saturation, and SNR (noise).


Figure 1.

What do we learn from the DxOMark database? Image sensors are better in 2023, and no 2 sensors are technically similar. The DxOMark database shows that the practical differences between sensors are tiny, and each image sensor is unique from a design or technical aspect. The DxOMark test results also showcase the improvements sensor manufacturers achieved in the past 20 years. 

Study this link.

How to use DxOMark to Compare two cameras. The following example teaches us how to interpret the DxO test database or how we create a visual reference for Acceptable Image Quality. I used the Olympus EM1 II and Canon R because they represent Pro cameras from 2016 to 2018.


The Canon R and the Olympus EM1 II.


DxOMark uses two "Image Quality" benchmarks for digital cameras. The first is what they define as Good Image Quality, and the second is Acceptable Image Quality. Good image quality means a color depth of 22, a dynamic range of 12EV, and a saturated sensor (+30db SNR) at base ISO. Each of the three variables has to be within the specified range for a camera to have good image quality.

What do we learn from the Sports Low-Light ISO? Many "experts" mistakenly suggest this category determines the camera's ability to use high ISOs. This category only specifies Acceptable Image Quality. That means the ISO (amplification) and specific exposure at the sensor to saturate the sensor with an SNR of 30dB, a Color Depth of 18, and a DR of 9EV. Study Figure 1 and this article.

Acceptable image quality is helpful because it shows us more about the sensor's exposure behavior. Do the following test to get a feel for what acceptable image quality looks like with an EM1 II:-

  • Find a similar scene to the above EP-3 photo and take an image in A-Mode at ISO400.
  • Increase the ISO to 1250 (1312) and take another photo. Inspect your Raw File in WS.


Olympus EP-3 with Lumix 20mm f1.7 lens - ISO200, f5, 1/800. Raw file converted and edited in Workspace. EP-3 "OOC" jpeg look.

Acceptable IQ does not imply we shouldn't use higher ISOs. This DxOMark rating says that any ISO value above 1312 (EM1 II) will underexpose the sensor, which reduces the color depth, DR, and SNR. We discussed sensor Saturation and SNR in these articles. Those studying my articles should be able to optimize any camera at higher ISOs. For example, we can increase (ETTR) the EM1 II/III exposure by up to 1EV. We can also explain why, plus manage visible image noise (Sony A7R4).


Sony A7R4 with FE 24-70mm f2.8 lens. (ISO3200, f7.1, 1/800) The A7R4 had Acceptable Image Quality and visible shadow noise at ISO3200.


What's the main advantage of using a Canon R? Let's say we like to capture a Grey Heron bird in flight (4th image above). That means upping the ISO by 3EV to ISO1600 for an increased shutter speed of 1/4000. The Canon R is within its sport (low light) range at ISO1600 with more than acceptable image quality. The EM1 II will deliver acceptable image quality with an ETTR of +1/2EV. One could also get the +0.5EV by increasing the aperture and ISO800 (similar DOF). Another parameter not included in the DxOMark scorecard is the AI noise reduction from Workspace. The mistake many make is the practical aspects of applying and using M43 versus full-frame cameras. 


Olympus EM5 II (one of the best) with the 12-35mm f2.8 Lumix Lens. ISO200, f5, 1/500 - Raw file converted in Workspace.

Is the visible noise the same for different cameras? An SNR of 30db does not mean the structure of the noise floor is identical for any two sensors. The visible part of the sensor's noise floor is different for the Olympus EM1 II and the Canon R. The reason is the sensor's noise floor is a function of sensor design and not sensor size. Take a few minutes to study the illustration in Fig 1.


Olympus EP-3 with Lumix 20mm f1.7 Lens - ISO200, f5, 1/640. Raw file converted and edited in WS. This is the EP-3 "OOC" jpeg look.


How does one apply the Overall DxO Rating? One of the most critical IQ variables in sensor design is Sensor Sensitivity. The sensor's sensitivity depends on its Optical and Quantum efficiencies plus its Pixel Area. For example, Live MOS, BSI, and low pixel count sensors are Optically more efficient than higher MP or Standard CMOS sensors. See my articles for more info on sensor sensitivity.

Why is it incorrect to say the ISO adjusts sensor sensitivity? The native sensitivity of the sensor is measured and adjusted at the factory. This means the sensor is calibrated for digital cameras as it leaves the factory. Size and capture advocates like to provoke meaningless discussions about the ISO offsets in the DxOMark database. The ISO standard states that the image brightness should double or half at every full-stop ISO adjustment (amplification). Nothing more or less...


EP-3 with Lumix 20mm f1.7 - ISO200, f5, 1/640. Raw file edited in WS. (>Acceptable IQ, Color Depth 20,8, DR 10.1EV, Low light 536)


Conclusion.


One of the most fascinating DxOMark test results is good Image Quality. This implies a color Depth of 22, a DR of 12EV, and an SNR of +30db (saturated sensor) at ISO200. DxOMark data shows that all the 16MP and 20MP cameras from Olympus have Good Image Quality, and the Olympus 10MP and 12MP cameras have more than acceptable Image Quality. Olympus cameras are some of the most exciting and cost-effective photography solutions for family, nature, and street photography.


The tiny IQ differences between M43 and APC sensors are also fascinating. For example, study the Olympus E-M5 versus the Canon 700D or the EM5 II versus the Canon 760D. Research the different sensor types in digital cameras, ie. BSI versus Live MOS or Standard CMOS. Most APC and Canon cameras have Standard CMOS sensors. The DxOMark database also highlights the theoretical inconsistencies in the "size and capture" theory. Finally, it's difficult to speculate why DxOMark failed to test the Panasonic GH5S, G9, and GH6 or the Olympus EM1X, EM1 III, or OM-1.

I trust you know why one can't say cameras have a Noise Floor, Saturation capacity, and Signal-to-Noise ratio (SNR) and simultaneously promote the idea that large sensors have less noise because they "capture" more light (commercial size and capture theory). This explains the animosity towards DxO and the ongoing critique of any DxOMark test results.


Canon G11 IS (10MP CCD), Raw file in PS, ISO80, f4.5, 1/250. (>Acceptable IQ, Color Depth 20,4, DR 11.1EV)

One of the biggest mistakes the "experts" make about M43 cameras is claiming two or more 16MP and 20MP cameras have the same Image Quality. The IQ characteristics of all cameras change with each sensor and Image Processor variation. For example, the various Live MOS sensors and TruePic VII, VIII, IX, and X combos offer meaningful IQ and performance variances.

What are the 5 additional reports DxOMark could add to its database:-
  • Basic sensor info - readout speed, AST, and DR.
  • Info about the sensor's noise floor, like size and types.
  • Create a test criteria to test & evaluate Image Processors.
  • Test & present the main benefits of using different sensor types.
  • The safety margin (ETTR gap) manufacturers apply at "100%" exposure.

See this article from DxOMark on sensor size and mobile phones - link.

All the best and God's Bless...

Siegfried

VideoPic Blog Comments

Please add any comments to this article here.

Most read Articles